The best way to identify potential uncontrolled confounders in a study is to follow two steps. First, simply think of other risk factors for the disease or problem. In the accident case above, this might include age, hours of safety training, amount of overtime worked, etc. Second, identify factors from among this list that could plausibly be related to the independent variable of interest. For example, amount of overtime worked could plausibly be related to which process the worker is assigned. If the process using stamping operations is also working more overtime, the process may appear to be associated with accidents even though it may be the overtime which is the cause.
In a study, you may be confused about which variables are risk factors and which are potential confounders. This is natural, since variables can be both risk factors and confounders, depending upon the relationships being examined. In the example above, if we were examining the relationship between working in the stamping operation and risk of injury, gender is a potential confounder. However, if we chose to examine the relationship between gender and the risk of injury, work in the stamping operation becomes the potential confounder.
A confounder acts either to increase or to decrease the observed value of a measure of association, relative to the true value of the measure of association. In the example above involving lifestyle and heart attack, the confounding effect of age increased the observed measure of association. In the other example, the confounding effects of gender tended to decrease the observed measure of association. Why did this occur?
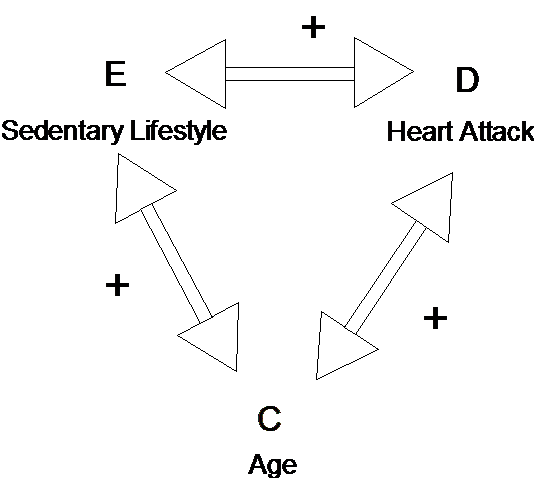
Let's diagram the relationships we have in the first example. Exposure E (sedentary lifestyle) is positively associated with Confounder C (age) (older people are more sedentary). Confounder C is positively associated with risk of disease (as age increases, risk increases) (see diagram below). We know that the result produces a positive effect on the observed measure of association (it distorts the observed measure of association to be greater than the true measure of association). This is true in general: a positive association between the confounder and both the exposure and disease produces a positive distortion on the observed measure of association between the exposure and disease.
Hypothetical confounding relationship of Age on the Sedentary Lifestyle - Heart Attack relationship

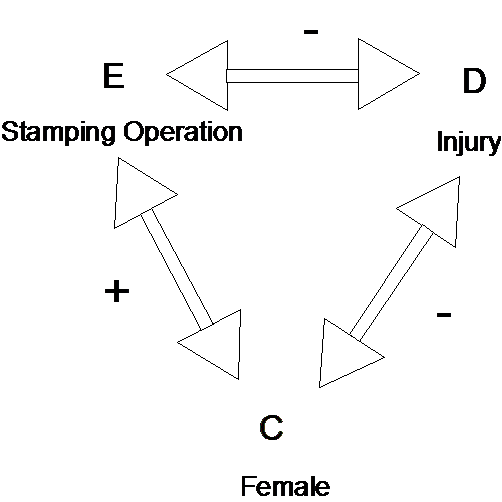
In the second example, working in the stamping operation (exposure) was positively associated with being female (confounder) (More women in the stamping operation). Being female was negatively associated with risk of injury (disease) (Women are less likely to be injured). Figure 2 illustrates the three-way relationship. As a result, the measure of association observed between stamping and injury was smaller than the true measure of association. In general, if the confounder is positively associated with the exposure and negatively associated with the disease (or vice versa) the observed measure of association between the exposure and disease is smaller (negatively distorted) as compared to the true measure of association.
Hypothetical confounding relationship of Gender on the Stamping Operation - Injury relationship

Have I Grasped the Key Concepts?
Interpretation Bias Evaluation Worksheet
The following list of questions help us work through potential interpretation bias in a study:
Interpretation Bias - are there plausible alternative explanations for the results?
- What do the results indicate with regard to the research question?
- Is there an adequate control group (is it possible to conclude what happens in the absence of the "causal" factor)?
- Are there plausible confounders that were not considered in the study? (include diagram and explanation)
- Is there any other reasons to believe that the author's interpretation could be erroneous?
Overall assessment of interpretation bias: _____ Low _____Moderate ____High
Explain: