Learning Objectives:
After successfully completing this lesson, students should be able to:
1.Calculate and interpret MOAs when one variable is quantitative and the other variable is nominal.
2.Generate MOAs when one variable is quantitative and the other variable is nominal using Epi Info.
3.Interpret and predict impact of MOAs when both variables are quantitative.
4.Generate MOAs when both variables are quantitative
Measures of Association (MOAs) for Quantitative Data
To find "causes" we look to our data for connections between an independent variable (factor) and a dependant variable (outcome or problem). But how will we see this in our data? The answer is Measures of Association. That is, a measure of the association between the two variables. In this learning module, we will discuss how to analyze data to discover connections when one or both variables are quantitative data.
It is important to note that all of the discussion that follows assumes we have eliminated alternative explanations for observed associations between variables, so we can be reasonably confident the associations are causal. This point will be covered in more detail later in the course.
Dependent Variable is Quantitative, Independent Variable is Nominal - Compare Means (or Medians): Ratio of Means, Difference of Means
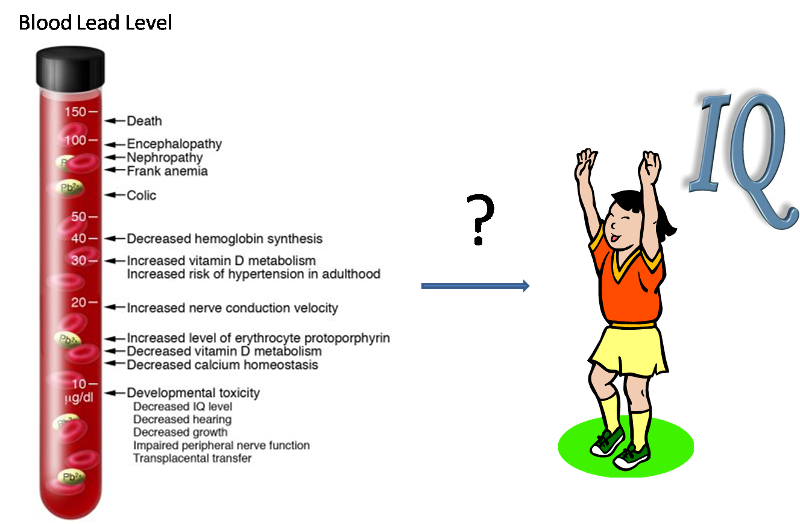
If we are concerned, for example, that exposure to lead may cause a drop in intelligence in children, then we might do a study to see if children exposed to lead have a lower IQ than those who are unexposed. But, how will the connection between IQ and lead exposure be evident in our data? Assume that in our study we identify whether each child has a blood lead concentration above 20 ug/dL, and we also determine the child's IQ with a psychological test.
Assume the results are as follows:
Table 1. Ratio of Means and Difference of Means for IQ and Blood Lead Level in children.
| Blood Lead level
|
Number of Children |
Mean IQ |
Ratio of Means |
Difference of Means |
|
Above 20 ug/dL |
127 |
98.2 |
Ref |
Ref |
|
20 ug/dL or below |
452 |
102.1 |
1.04 |
3.9 |
Note that we begin by calculating the mean IQ among each group of children. The mean IQ is higher in the low-lead group, though it is difficult to know the clinical significance of this difference without some medical consultation. Nevertheless, we'd like to more clearly understand the magnitude of this difference.
One way to do this is a ratio of the two means (RM), using the high-lead group as the reference group, we can calculate RM to be 102.1/98.2, or 1.04. We interpret this as:
The average IQ of children with blood lead levels of 20 ug/dL or below is 1.04 times as high as (or 4% higher than) children with blood lead levels above 20 ug/dL.
Note reference group refers to the group in the denominator in calculating RM. In another word, when calculating RM, we need to put the average of the rerferencve group in the demoniator. Once a group is used as a reference group, we don't need to calculate RM for that group.
Alternatively, we could subtract the means instead of dividing them, to produce a Difference of Means (DM). Using the high-lead group as the reference group, we can calculate DM to be 102.1 - 98.2, or 3.9.
We could interpret it as follows:
The average IQ of children with blood lead levels of 20 ug/dL or below is 3.9 IQ points higher than children with blood lead levels above 20 ug/dL.
In calculating DM, the reference group refers to the second term/group in subtraction. In another word, when calculating DM, we need to put the avarege of the reference group as the second term in subtraction. Once a group is used as a reference group, we don't need to calculate DM for that group.
Have I Grasped the Key Concepts Here?
A study was conducted to examine the relationship between a child's blood lead level and a child's IQ score. Results are summarized in the table below (Note the group of blood lead level of above 20 ug/DL is used as the reference group).

Based on above table, answer the following questions: