Practical Skills - Compare Means/Medians of Multiple Groups (MOAs when one variable is quantitative and one is nominal)
The following video shows how to compare means/medians of multiple groups using Epi Info. I have also included written instruction for your reference below.
![]()
To compare means/medians of multiple groups (i.e. MOAs when one variable is quantitative and one is categorical), we need to use the "MEANS" command. For example, for the SSI dataset, let's say we want to compare "SURGEXP" (a quantitative variable) for cases that are infected with cases that are not infected. To do this:
- Under "Statistics", click on "Means".
- Under the "Means of" window, click on the dropdown arrow and select the quantitative variable. In our example, this would be "SURGEXP".
- Under the "Cross-Tabulate by Value of" window, click on the dropdown arrow and select the nominal/ordinal variable. In our example, this would be "INF" (INF is a categorical variable with two categories:1-Yes, 0 - No).
- Click on "OK".
- Under the heading "MEANS SURGEXP INF", you see a table under the title "Descriptive Statistics for Each Value of Crosstab Variable".
- This table tells us the mean, median and mode for each group as shown below.
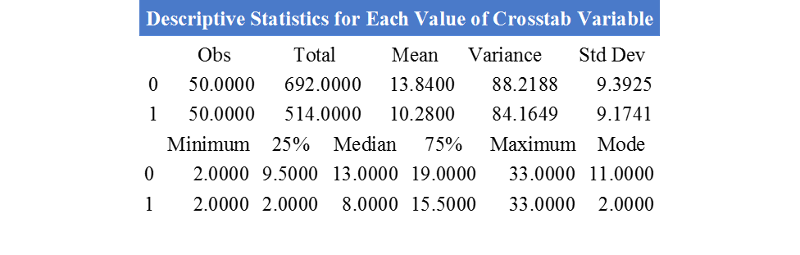
Remember for variable "INF", 0 - No and 1 - Yes. So from the table, we can obtain the following results:
Mean surgerical experience for "not infected" group = 13.84; Mean surgerical experience for "infected" group =10.28
Median surgerical experience for "not Infected" group = 13.00; Median surgerical experience for "infected" group = 8.0.