Both Variables are Quantitative - Slope: Scatter Plots, Regression and the Equation of a line
How should we analyze data to discover connections between two quantitative variables? Let's start with an professional scenario.
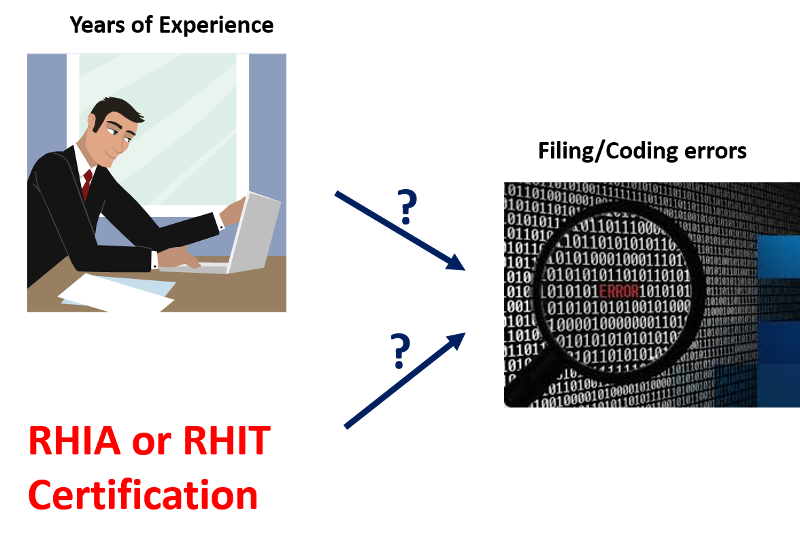
Is years of experience associated with filing/coding errors?
Let's go back to the scenario about medical records unit in a hospital. You are concerned about the number of errors that are made in the unit when filing/coding diagnoses and procedures. In order to determine the best corrective action to take, you collect information for each of your employees on the number of filing/coding errors made in the last month (per 1000 records filed), whether the employee is a RHIA or RHIT, and the number of years of experience in filing/coding. In the previous section, we have discussed how to evaluate the relationship between certification and filing/coding errors. In this section, we will discuss how to evaluate the relationship between years of experience and filing/coding errors.
Since both variables (i.e., "years of experience" and "Filing errors (per 1000 records filed)" are quantitative, we start by making a scatter plot of the data, see Figure 1 below. Notice "Years of experience" is plotted as the X-axis (i.e. the independent variable) and "Filing errors (per 1000 records filed)" is plotted as the Y-axis (i.e. the dependent variable). It is important to remember that we always plot the issues or outcomes (i.e. dependent variable) as the "Y-axis" (in this case, "filing errors (per 1000 records filed)" certainly is a problem so it is ploted as the Y-axis) and we plot potential causal factor (i.e. independent variable) as the X-axis (in this case, "years of experience" is speculated as a causal factor affecting the number of filing errors made).
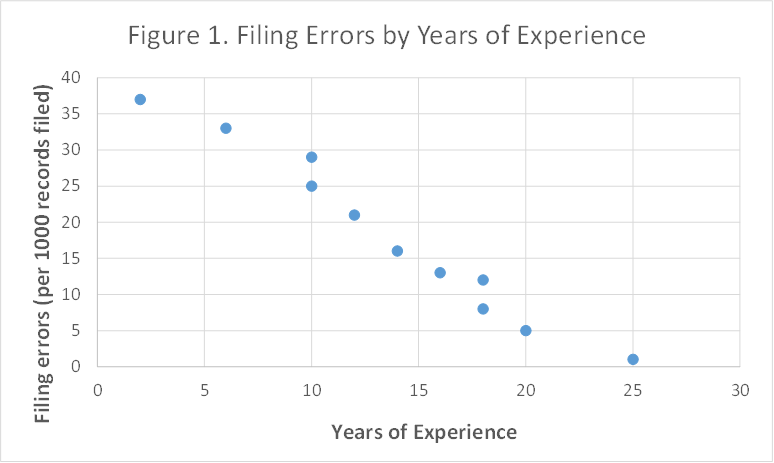
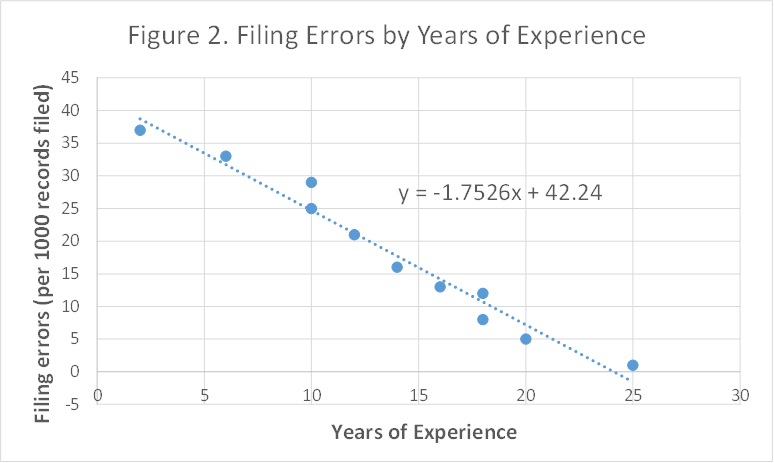
The data suggest a downward (negative) relationship. That is, the more years of experience, the fewer errors are made. These data points all clustered around a line suggesting a linear relationship, so we could try to draw a line through the data, trying to get the best "fit". However, we can use the computer to fit the line for us, using linear regression analysis. The process fits the line and calculates the equation of that line that minimizes the scatter of points around the line. The results, using Microsoft Excel, are presented in Figure 2 below.
The equation of the line follows the general form of
y = mx + b
where:
m=slope
b=intercept.
Recall that intercept is the value of Y when X is zero and slope (also called the regression coefficient) is the change in Y when X increases by one unit. In the above case of filing errors, the intercept of 42.24 tells us that, on average, someone with zero years of experience is most likely to make about 42 filing errors per 1000 records filed. Now let's try to interpret the regression coefficient/slope:
1) First, we need to figure out what does "X increases by one unit" mean in this setting.
X-variable in this case is "years of experience". So when "X increases by one unit", it means "years of experience increases by one (year)".
2) Second, we need to find out the "change in Y" (i.e. "Y will change by _____(the regression coefficient)" when X increases by one unit in this setting.
Y-variable in this case is "Filing errors (per 1000 records filed)". From the graph, we can see that slope/regression coefficient is "-1.7526", then "change in Y" or "Y will change by ____(the regression coefficient)"
in this setting would mean "Filing errors will change by -1.7526 errors (per 1000 records filed) (i.e. decrease by 1.7526 errors (per 1000 records filed)".
Connecting 1) and 2) together, we can interpret the regression coefficient as following:
When years of experience increases by one (year), filing errors will change by -1.7526 errors (per 1000 records filed) (or decrease by 1.7526 errors (per 1000 records filed)).
Note:
A "+" regression coefficient means "Y increase by (or change by) a positive amount when X increases by one unit".
A "-" regression coefficiednt means "Y decrease by a positive amount (i.e. Y change by a negative amount) when X increases by one unit".
Predicting Change in Y-variable using Regression Coefficient
Of these two values, the slope/regression coefficient is usually more important, since it tells us how much we might be able to improve the situation (i.e. Y-variable) if we can change the independent variable (x).
For example, in the above case, what would be the impact on filing errors if years of experience increases from current 5 years to 10 years?
When years of experience increases by one (year), filing errors will change by -1.7526 errors (per 1000 records filed) (i.e. decrease by 1.7526 errors (per 1000 records filed))
When years of expereince increases from current 5 years to 10 years (change in X-variable = Xfuture - Xcurrent = 10 - 5 = 5 years), filing errors will change by = -1.7526 x 5 = - 8.763 errors (per 1000 records) (i.e. decrease by 8.763 errors (per 1000 records)).
In general, we can apply the following formula to predict change in Y-variable using regression coefficient:
Change in Y-variable = Regression coefficient x (Change in X-variable) = Regression coefficient x (Xfuture - Xcurrent)