One More Example of MOAs using Ratio of Means or Difference of Means
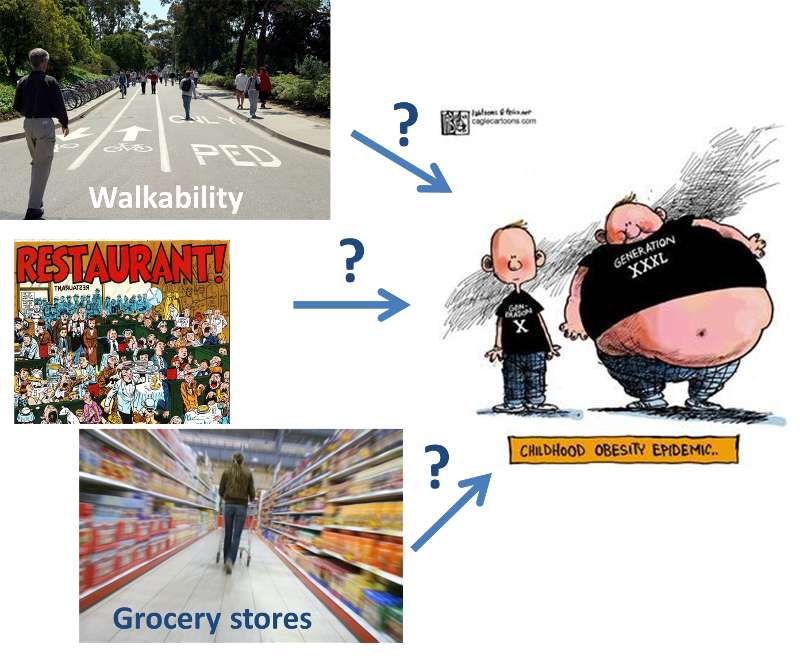
Is community environment associated with childhood obesity?
You are a environmental health specialist for Big Weight County Health Department. Needs assessment has indicated childhood obesity is a major problem in your county. As a matter of fact, childhood obesity is a new epidemic for our country. Check out the video below for some background information.
The director of your department learned from other county health departments that community environment such as perceived walkability or number of restaurants/grocery stores could help reduce obesity. Before he submits a proposal to the mayor about changing community environment, he wants you to check on the latest research that examines the relationship between community environment variables and childhood obesity and to give him suggestions on what community environment characteristics should be changed.
Below is the newest research you came across*:
A total of 45 public elementary schools from nine school districts with a total of 1624 children were recruited for the study. Measured child weight and height were obtained by trained evaluation assistants using portable scales and stadiometers, respectively. Body mass index (BMI) was calculated based on weight and height. Community environment variables measured include:
- Perceived walkability of the neighborhood (parent report)
- Number of restaurants within 1 mile from school
- Number of grocery stores within 1 mile from school
* Modified from Journal of School Health, January 2010, Elder, J. P. et al. "Individual, family and community environmental correlates of obesity in Latino Elementary School Children".
To assess perceived walkability, a modified version of the US Department of Transportation, Partnership for a Walkable American, Pedestrian and Bicycle Information Center and the United States Environmental Protection Agency's Walkability Checklist was used. Ten questions assessed perceived neighborhood safety/aesthetics, including the presence of crime, lights, and vehicle exhaust in the neighborhood. The final model included a summarized score assessing perceived neighborhood walkability with the maximum score of 10 points and minimum score of 0 points). The number of restaurants and grocery stores within 1 mile from school are analyzed using GIS.
Table 1. Perceived walkability of neighborhood, number of restaurants and grocery stores and children's weight status (Partially fictitious)
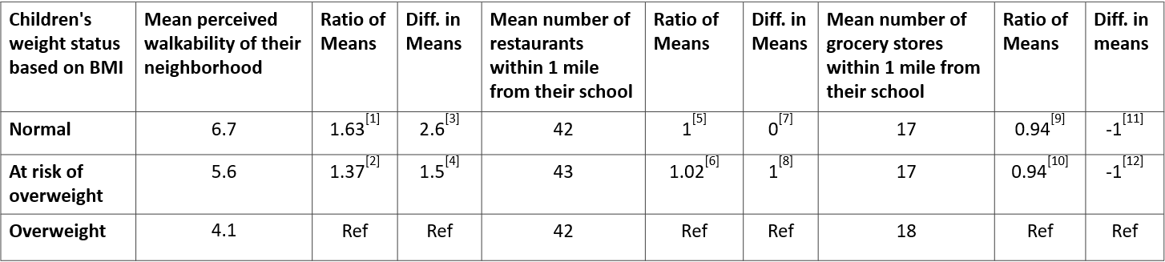
Note the group of overweight is used as the reference group.
[1] 6.7/4.1 = 1.63; The average perceived walkability of normal-weight children's neighborhoods is 1.63 times as great as that of overweight children's neighborhoods.
[2] 5.6/4.1 = 1.37; The average perceived walkability of at-risk-of-overweight children's neighborhoods is 1.37 times as great as that of overweight children's neighborhoods.
[3] 6.7 - 4.1 = 2.6; The average perceived walkability of normal-weight children's neighborhoods is 2.6 points greater than that of overweight children's neighborhoods.
[4] 5.6 - 4.1 = 1.5; The average perceived walkability of at-risk-of-overweight children's neighborhoods is 1.5 points greater than that of overweight children's neighborhoods.
[5] 42/42 = 1; The average number of restaurants within 1 mile from normal-weight children's schools is the same as that from overweight children's schools.
[6] 43/42 = 1.02; The average number of restaurants within 1 mile from at-risk-of-overweight children's schools is 1.02 times as great as that from overweight children's schools.
[7] 42-42 = 0; The average number of restaurants within 1 mile from normal-weight children's schools is the same as that from overweight children's schools.
[8] 43-42 = 1; The average number of restaurants within 1 mile from at-risk-of-overweight children's schools is one more than that from overweight children's schools.
[9] 17/18 = 0.94; The average number of grocery stores within 1 mile from normal-weight children's schools is 0.94 times as great as that from overweight children's schools.
[10] 17/18 = 0.94; The average number of grocery stores within 1 mile from at-risk-of-overweight children's schools is 0.94 times as great as that from overweight children's schools.
[11] 17-18 = -1; The average number of grocery stores within 1 mile from normal-weight children's schools is one less than that from overweight children's schools.
[12] 17-18 = -1; The average number of grocery stores within 1 mile from at-risk-of-overweight children's schools is one less than that from overweight children's schools.
Based on above results, we can see:
- Perceived walkability increases as a child BMI increases, shown by the ratio of means increasing as a child BMI increasing (1.37 for at-risk-of-overweight children and 1.63 for normal-weight children) and difference in means increasing as a child BMI increasing (1.5 for at-risk-of-overweight children and 2.6 for normal-weight children);
- Number of restaurants within 1 mile from a child's school doesn't seem to change much by a child's BMI, ratio of means are close to 1 (1 for normal-weight children, and 1.02 for at-risk-of-overweight children) and difference of means are close to 0 (0 for normal-weight children and 1 for at-risk-of-overweight children). This indicates little if any association/connection between number of restaurants within 1 mile from a child's school and a child's BMI;
- Number of grocery stores within 1 mile from a child's school doesn't seem to change much with a child's BMI, ratio of means are close to 1 ( 0.94 for both normal-weight children and at-risk-of-overweight children) and difference of means are close to 0 (-1 for both normal-weight children and at-risk-of-overweight children). This indicates little if any association/connection between number of restaurants within 1 mile from a child's school and a child's BMI.
Therefore, we can conclude only the perceived walkability of a child's neighborhood is connected with a child's weight status. Number of restaurants or number of grocery stores within 1 mile from a child's school do not seem to be connected with a child's weight status. So based on this study, what community environment characteristics should be changed to reduce childhood obesity? Perceived walkability!
Have I Grasped the Key Concepts Here?
Case #1. A study was conducted to examine the perceived walkability of a child's neighborhood, number of grocery stores within 1 mile from a child's school and a child's weight status, results are summarized below (Note the group of overweight is used as the reference group):

Based on above table, answer the following questions:
In terms of grocery stores with 1 mile from a child's school;
More Practices...
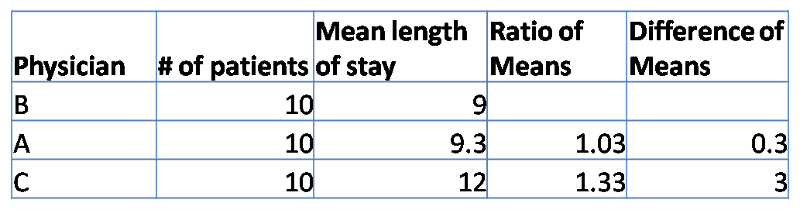
Case #2: You work with a small rural hospital. The hospital is losing nearly 50% on its Medicare patients due to extremely long length of stays (LOS). You believe it may be due to individual practices of the three community physicians and due to age of the patients. You randomly select 10 cases from each physician and collect information on LOS and age of patient. Your results are in Table 3 below. To what extent does physician or age appear to be related to LOS?
TABLE 3: Length-of-stay, physician, and age of patient for 30 patients at ACME Hospital , 2013.
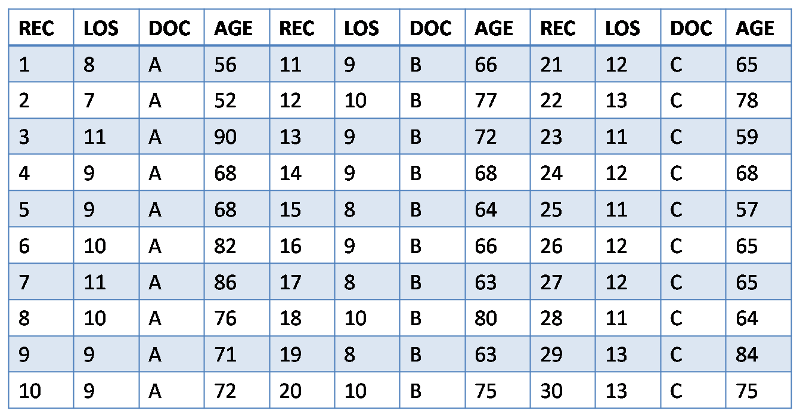
REC=subject number, LOS=length of stay (days), DOC=physician, AGE=patient age in years
The following four questions are based on the table below which summarized the relationship between physician and Length of stay (LOS) in days (Note physician B is used as the reference).