Learning Objectives:
After successfully completing this lesson, students should be able to:
1. Choose appropriate measure of association for nominal and ordinal data
2. Calculate and interpret:
- Rates
- Rate Ratio or Relative Risk (RR)
- Attributable Risk (AR)
- Attributable Proportion (AP)
3. Generate measure of association for nominal and ordinal data using Epi Info.
Measures of Association (MOAs) for Nominal and Ordinal Data - Finding connections between variables
To find "causes" we look to our data for connections between an independent variable (potential causal factor) and a dependent variablele (outcome or problem). But how will we see this in our data? The answer is Measures of Association. That is, a measure of the association between the two variables.

It is important to note that all of the discussion that follows assumes we have eliminated alternative explanations for observed associations between variables, so we can be reasonably confident the associations are causal. This point will be covered in more detail later in the course.
When Both Variables Are Nominal - Compare proportions: Rates, Rate Ratio, Attributable Risk, Attributable Proportion
If we are concerned, for example, that exposure to benzene may cause leukemia, then we might do a study to see if refinery workers exposed to benzene have a greater risk of leukemia than those who are unexposed.
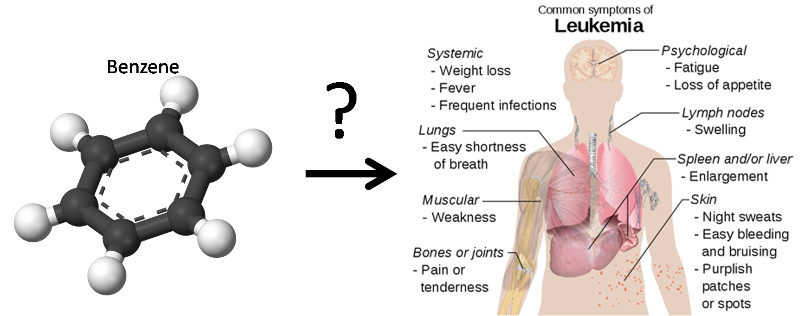
The following video might also help you to know more about acute myeloid leukemia (Note you can select full screen if you want).
![]()
But, how will the connection between leukemia and benzene exposure be evident in our data? Assume we collected the following data in our study:
Table 1. Leukemia rates and rate ratio (RR) for refinery workers by benzene exposure.
| Benzene Exposure
|
Number of Workers |
Number of workers developing Leukemia |
Leukemia Rate (per 1000 workers) |
RR (Rate Ratio) |
|
Yes |
3,000 |
25 |
8.33[1] |
4.71[3] |
|
No |
30,000 |
53 |
1.77[2] |
|
In our study, we noted the number of workers exposed to benzene and the number not exposed. We also noted how many workers in each group developed leukemia (note that both the dependent variable "Leukemia" and the independent variable "Benzene exposure" are nominal, i.e. Leukemia (Yes, or No) and Benzene exposure (Yes, or No). From this we can calculate the leukemia rate in each group:
[1]: 8.33 = (25/3,000) x 1,000;
[2]: 1.77 = (53/30,000) x 1,000
It is obvious, by comparing the leukemia rates in the two groups that the risk of leukemia is much higher among those exposed to benzene. We can better quantify this excess rate by taking a ratio of the two rates creating a rate ratio, or RR (also called a risk ratio, or the relative risk):
[3]: Risk ratio, or relative risk (RR)= 8.33/1.77 = 4.71
We interpret the rate ratio as follows:
The risk of leukemia among exposed workers is 4.71 times as great as the risk among non-exposed workers.
This is very useful information. It suggests that benzene exposure dramatically increases one's risk of leukemia. Note here that non-exposed workers is used as the reference group. Reference group refers to the group in the denominator in calculating RR. In another word, when calculating RR, rate of reference group should always be the denominator. Once a group is used as a reference group, we don't need to calculate RR for that group (i.e. RR is not needed for a reference group).
Alternatively, we could subtract the rates instead of dividing them (Table 2). This is sometimes called Attributable Risk (AR), Risk Difference (RD), or Difference in Attack Rate (DAR).
Attributable Risk (AR), Risk Difference (RD), or Difference in Attack Rate (DAR)= 8.33 -1.77 = 6.56
Note there that non-exposed workers is again used as the reference group. In another word, when calculating AR or RD, rate of reference group should be the second term in subtraction.
Once a group is used as a reference group, we don't need to calculate AR or RD for that group (i.e. AR or RD is not needed for a reference group).
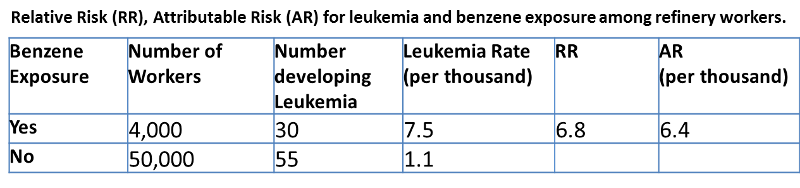
Table 2. Relative Risk (RR), Attributable Risk (AR) and Attributable Proportion (AP) for leukemia and benzene exposure among refinery workers.
| Benzene Exposure
|
Number of Workers |
Number developing Leukemia |
Leukemia Rate (per 1000 workers) |
Relative Risk (RR)
|
Attributable Risk (AR) (per 1000 workers) |
Attributable Proportion (AP) |
|
Yes |
3,000 |
25 |
8.33 |
4.71 |
6.56 |
79% |
|
No |
30,000 |
53 |
1.77 |
|
|
|
Attributable Risk (AR) is a bit more difficult to interpret than RR but can be just as useful. In this case we could interpret Attributable Risk (AR) as follows:
In workers exposed to benzene, the amount of leukemia risk that is attributable (caused by) their exposure to benzene is 6.56/1000.
In other words, total leukemia risk among exposed workders is 8.33/1000, but only 6.56/1000 seems to be due to the benzene. The other 1.77/1000 seems to be due to other factors, since people have this risk of leukemia even when they are not exposed to benzene. Another way of saying this is that bezene exposure seems to increase ones risk of leukemia by 6.56/1000.
The Attributable Proportion (AP) states this in relative terms. By dividing the AR by the Leukemia Rate, we find the proportion of leukemia risk among exposed workers that seems to be due to benzene exposure. In this case, about 79% of exposed workders leukemia risk appears to be due to benzene exposure (6.56/8.33 x 100 = 79%). Or stated another way, if these workers had not been exposed to benzene, their luekimia risk would be about 79% less.
Have I Grasped the Key Concepts Here?
In a study of leukemia and benzene exposure among refinery workers, the following result is obtained (workers without benzene exposure is used as the reference group) :
Based on the above table, answer the following questions.