Practical Skills - How to Generate A Contingency Table, RR and AR using Epi Info?
The following video shows you how to generate a a contingency table (also referred to as cross tabulation or cross tab) that contains critical information needed for calculation of rate, RR and AR. Please note the procedure in this video also applies when independent variable is ordinal (discussed on pages 4-5 in this lesson). I have also included written instruction below for your reference.
![]()
Make sure you have told Epi Info to read the dataset you want to use before you can analyze it (If you forget how to do this, go to Lesson Two, Page 2 for a video on how to "Read a Dataset - 1st Step of All"). After you have read the dataset in Epi Info,
- Go to "Statistics", select "Tables". Select an independent variable (i.e. possible causal factor) into the "Exposure Variable" window, and a dependent variable (i.e. a problem or an outcome) into the "Outcome Variable" window. In another word, the exposure variable is a variable that could influence or make a difference for the outcome variable. Let's say we want to examine if gender of a patient could influence or make a difference in someone's likelihood of infection, then we pick "GENDER" (i.e. causal factor/independent variable) into the "Exposure Variable" window and "INF" (i.e outcome/dependent variable) into the "Outcome Variable" window. Don't switch the two.
- Click "OK" and after a moment, a contingency table should appear in the output area under the title "TABLES GENDER INF". Scroll down and you should see RR and RD% (i.e. AR) under the title "Single Table Analysis". The following example will illustrate STEP BY STEP how to use Epi info to solve a particular problem using RR and RD% (i.e. AR) generated from Epi Info.
Using Epi Info to Solve a Problem
Let's go back to our Titanic dataset (remember you have used it in your homework assignment #2). As we investigate factors that may have influenced one's likelihood of survival in the accident, we may wonder whether "AGE" (nominal, adult vs. child) could be a factor associated with surviving in the accident. To find out, we need to use Epi Info to generate a contingency table, RR and AR using the "TABLES" command. Independent variable in this case is "AGE" (since it is a potentail causal factor) and dependent variable is "SURVIVED" (i.e. the outcome). The contingency table looks like below:
.wmf.png)
Note: AGE (1 = adult, 0 = child); SURVIVED (1 = yes, 0 = no)
In addition, Epi Info also generated many statistics under the title "Single Table Analysis" as shown below
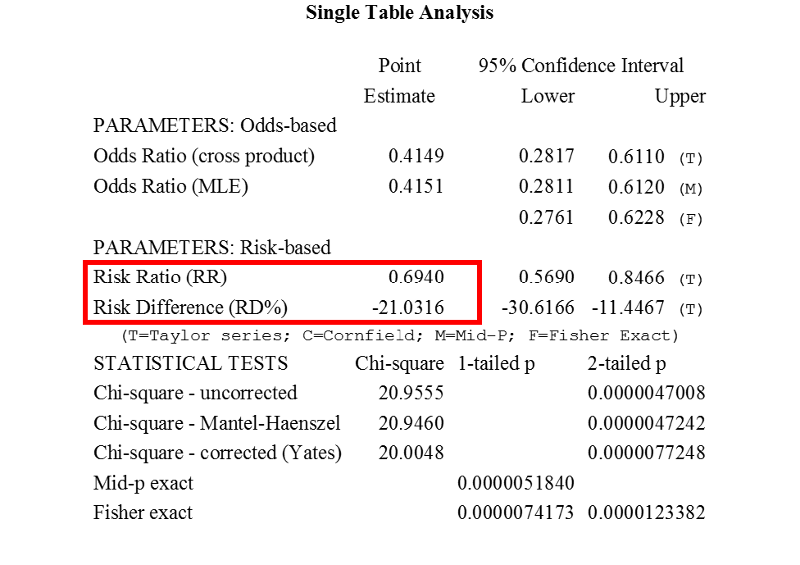
The two most important pieces of information relevant to us is the RR of 0.6940 and AR (i.e. RD% in the table) of -21% (Notice % is added since RD% is presented in the table). Now, naturally we wonder which (Adult or Child) is the reference when RR and AR is calculated by Epi Info. The answer is in the contingency table. The category listed in the top row (in this case, AGE = 0 (i.e. child) is used as the reference for RR and AR calculation. Now we can solve the problem!
RR of 0.6940 tells us that likelihood of surviving for an adults is only 0.694 times as great as the risk for a child.
AR of -21% tells us that being an adult seemed to decrease one's likelihood of surviving by 21%
So, age is a factor associated with one's likelihood of surviving.
If independent variable is an Ordinal Varilable (if independent variable is a nominal variable, see above for RR and AR)
Unfortunately Epi Info will not generate RR and RD% (i.e. AR) for each category of the ordinal variable, it will only generate a contingency table. So we will have to manually calculate RR and AR for each category of the ordinal variable. Now, how would we calculate RR and AR from a contingency table generated by Epi Info? Let's use the contingency table of "AGE" and "SURVIVED" from above as an example.
Note: AGE (1 = adult, 0 = child); SURVIVED (1 = yes, 0 = no)
It is a very busy and confusing table. So, let's just focus on counts in the above table (ignore the % scores, just focus on the whole numbers) and rewrite the table into the following format:
|
Age |
Survived |
|
|
No |
Yes |
|
|
Child |
52 |
57 |
|
Adult |
1438 |
654 |
Now, we can easily find out the survival rate for children and adults as well as RR and AR. We can choose any of the category as the reference category, let's use "Adult" as the reference here. Let's present them in a standard table with rates, RR and AR as below:
|
Age |
Number of People |
Number of people survived |
Survival Rate |
RR |
AR |
|
Child |
109[1] |
57 |
52%[3] |
1.7[5] |
21%[6] |
|
Adult |
2092[2] |
654 |
31% [4] |
|
|
[1] 109 = 52+57
[2] 2092 = 1438 + 654
[3] 52% = 57/109
[4] 31% = 654/2092
[5] 1.7 = 52%/31%, the likelihood of survival for a child is 1.7 times as great as the likelihood for an adult.
[6] 21% = 52% - 31%, being a child seemed to increase the likelihood of survival by 21%.