When Independent Variable is Ordinal
When the independent variable is ordinal, use the same MOAs as you would if the independent variable were nominal - except look for a trend rather than simply a difference. For example, assume we were examining the relationship between childhood blood lead level and whether the child is diagnosed with a "learning disability", and we collected some data. However, before we dig into the data analysis, you might want to watch a couple of videos to understand some basic information on lead poisoning in childhood (Note you can select full screen if you want):

![]()
![]()
We get the following data (some columns were omitted to save space).
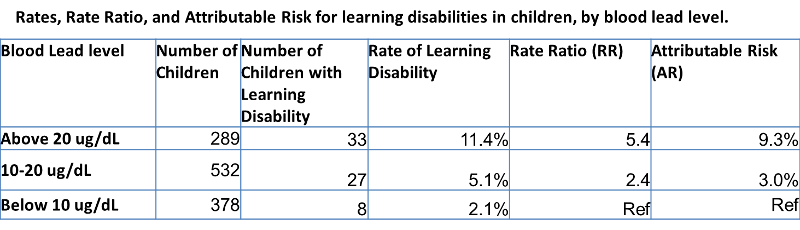
Table 3. Rates, Rate Ratio, and Attributable Risk for learning disabilities in children, by blood lead level.
| Blood Lead
|
Number of Children |
Number of Children w/ Learning Disability |
Rate of Learning Disability
|
Rate Ratio (RR) |
Attributable Risk (AR) |
Attributable Proportion (AP) |
|
Above 20 ug/dL |
127 |
16 |
12.6%[1] |
5.8[4]
|
10.4%[6]
|
82.5%[8] |
|
10-20 ug/dL |
267 |
14 |
5.2%[2] |
2.4[5]
|
3.0%[7]
|
57.7%[9] |
|
Below 10 ug/dL |
183 |
4 |
2.2%[3] |
|
|
|
Note the group of blood lead level below 10 ug/dL is used as the reference group.
[1] 16/127 = 0.126 = 12.6%
[2] 14/267 = 0.052 = 5.2%
[3] 4/183 = 0.022 = 2.2%
[4] 5.8 = 12.6%/2.2%;
Interpretation: The risk of learning disability among children with blood lead level of above 20 ug/dl is 5.8 times as great as the risk among children with blood lead level below 10 ug/dl.
[5] 2.4 = 5.2%/2.2%;
Interpretation:The risk of learning disability among children with blood lead level of 10-20 ug/dl is 2.4 times as great as the risk among children with blood lead level below 10 ug/dl.
[6] 10.4% = 12.6%-2.2%;
Interpretation: In children with blood level of above 20 ug/dl, the amount of learning disability risk that is attributable (caused by) their lead blood level is 10.5%; or Blood lead level of 20 ug/dl seems to increase a child's learning disability risk by 10.5%.
[7] 3.0%=5.2%-2.2%;
Interpretation: In children with blood level of 10-20 ug/dl, the amount of learning disability risk that is attributable (caused by) their lead blood level is 3.0%; or Blood lead level of 10-20 ug/dl seems to increase a child's learning disability risk by 3.0%.
[8] 82.5% = 10.4%/12.6%
Interpretation: 82.5% of learning disability risk in children with lead blood level of above 20 ug/dl appears to be due to their lead blood level; or if these children's lead blood level were reduced to below 10 ug/dl, their learning disability risk would be 82.5% less.
[9] 57.7% = 3.0%/5.2%
Interpretation: 57.7% of learning disability risk in children with lead blood level of 10-20 ug/dl appears to be due to their lead blood level; or if these children's lead blood level were reduced to below 10 ug/dl, their learning disability risk would be 57.7% less.
Note that we use the same MOAs we would if blood lead level had been nominal - rates, RR, and AR. However, because blood lead level is ordinal, we are looking primarily for a trend in these values. In this case, a trend is obvious. As blood lead level goes up, so does the rate of learning disabilities (and RR and AR and AP). This is strong evidence of a link between these two variables.
Have I Grasped the Key Concepts Here?
A study was conducted to examine the relationship between childhood lead blood level and whether a child has a learning disability or not. Results were summarized in the table below (Note the group of blood lead level below 10 ug/dL is used as the reference group here).
Based on the above table, answer the following questions: