Another Example of MOAs When Independent Variables Are Ordinal
You work in an urban health department in the tuberculosis treatment center, where patients with active TB come for monitored treatment. It is critical that patients return for treatment throughout the treatment period (several months), because stopping the treatment early can result in developing antibiotic resistance, making the disease much more difficult to treat. You are concerned that the distance the patient must travel is a major factor in determining whether they stay in the program.

You survey patients as they enter the program and then follow them to see if they complete the treatment. After 6 months, you have the following data:
- Travel under 1 mile: Total patients: 117 Patients dropping out: 20
- Travel 1-3 miles: Total patients: 56 Patients dropping out: 22
- Travel more than 3 miles: Total patients: 37 Patients dropping out: 27
A. Identify the subjects, dependent variable(s) and independent variable(s)
B. Construct a standard table and determine the extent to which the problem is related to the distance traveled. Explain your results, using the measures of association. Clarity in your presentation (use a table) and your analysis of data are important.
ANSWER
A. Subjects: Patients at TB treatment center
Dependent Variable: Dropping out (Nominal: Yes, or No)
Independent Variable: Travel distance (Quantitative)
B. The data can be summarized in a table such as the one below.
| Distance
|
Number of Patients |
Patients Dropping Out |
Dropout Rate |
Relative Risk |
Attributable Risk |
|
<1 |
117 |
20 |
17%[1] |
|
|
|
1-3 |
56 |
22 |
39%[2] |
2.3[4] |
22%[6] |
|
Over 3 |
37 |
27 |
73%[3] |
4.3[5] |
56%[7] |
Note the group of traveling distance less than 1 mile is used as the reference group here.
[1] 17% = 20/117
[2] 39% = 22/56
[3] 73% = 27/37
[4] 2.3 = 39%/17%
Interpretation: The risk/likelihood of dropping out among patients who travel 1-3 miles is 2.3 times as great as the risk/likelihood among patients who travel under 1 mile.
[5] 4.3 = 73%/17%
Interpretation: The risk/likelihood of dropping out among patients who travel more than 3 miles is 4.3 times as great as the risk/likelihood among patients who travel under 1 mile.
[6] 22% = 39% - 17%
Interpretation: Traveling 1-3 miles seems to increase the risk/likelihood of dropping out by 22%
[7] 56% = 73% - 17%
Interpretation: Traveling more than 3 miles seems to increase the risk/likelihood of dropping out by 56%
Results indicate that the farther patients much come for treatment, the higher their drop out rate. Those who must travel 1-3 miles are more than twice as likely to drop out than those who travel less than a mile. Those who must travel over 3 miles are more than 4 times as likely to drop out as those who must travel less than a mile. Results suggest that locating treatment centers closer to patients, or perhaps providing them with transportation, could reduce the drop out rates dramatically.
One More Example of MOAs When Independent Variables Are Ordinal
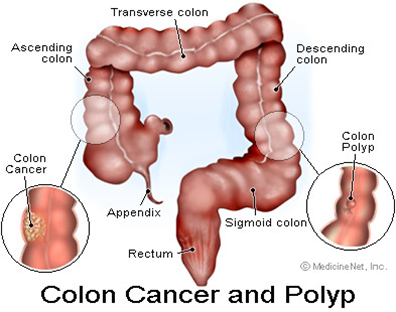
You are a health educator working for American Cancer Society. One of the project you are involved is looking at "Interventions to increase colon cancer screening in Filipino Americans". According to CDC, colon cancer is the third leading cancer killer in the U.S.
You may watch the video below to learn more on colon cancer screening (Note you can select full screen if you want to):
![]()
In this project, nearly 550 study participants were randomly assigned to one of three groups - two intervention groups and one control. Those in the intervention groups received an education session, printed take-home materials, a reminder letter, and a letter to physicians. The only difference between the two intervention groups was that one received a free take-home screening kit, while the other group did not. People in the control group had a session promoting physical activity. Six months after the intervention, participates are surveyed to see if they have completed the screening. The following data are collected:
- Intervention with free take-home screening kit: Total participants: 180 Participants completed screening: 54
- Intervention without free take-home screening kit: Total participants: 188 Participants completed screening: 45
- Control (i.e. no intervention): Total participants: 180 Participants completed screening: 16
A. Identify the subjects, dependent variable(s) and independent variable(s)
B. Construct a standard table and determine the extent to which the problem is related to the distance traveled. Explain your results, using the measures of association. Clarity in your presentation (use a table) and your analysis of data are important.
ANSWER
A. Subjects: Filipino Americans participated in the study
Dependent Variable: Colon cancer screening (Nominal: Yes, or No)
Independent Variable: Intervention (Ordinal: No; intervention w/o kit; intervention w kit)
B. The data can be summarized in a table such as the one below.
|
Interventions |
Number of Participants |
Participants completed screening |
Screening Rate |
Rate Ratio |
|
Intervention with free take-home screening kit |
180 |
54 |
30%[1] |
3.4[4] |
|
Intervention without free take-home screening kit |
188 |
45 |
25%[2] |
2.8[5] |
|
Control (i.e. no intervention) |
180 |
16 |
8.9%[3] |
|
Note the control group is used as the reference group here.
[1] 54/180 = 30%
[2] 45/188 = 25%
[3] 16/180 = 89%
[4] 3.4 = 30%/8.9%; the likelihood of completing a colon screening test among participants who had gone through the intervention with free take-home screening kit is 3.4 times as great as the likelihood among participants who had not gone through any intervention.
[5] 2.8 =25%/8.9%; the likelihood of completing a colon screening test among participants who had gone through the intervention without free take-home screening kit is 2.8 times as great as the likelihood among participants who had not gone through any intervention.
Results indicate that the intervention particularly the intervention with free take-home screening kit are effective in getting people to complete a colon cancer screening test.
Note the above example shows another application of MOAs in evaluating effectiveness of certain intervention programs. In this case, the intervention increased rate of a good thing (i.e. colon screening test), indicated by rate ratios of greater than one.
Also notice, instead of saying "risk of a certain disease", here we used "the likelihood of a certain event" (i.e. the likelihood of completing colon screening test). Had we used the wording "the risk of completing a colon screening test", it would imply INCORRECTLY that colon screening test is a bad thing.
So in summary, if we want to talk about probability of a good thing happening, we typically say "the likelihood of a good thing is ....."; if we want to talk about probability of a bad thing happening, we typically say "the risk of a bad thing is ....".
Have I Grasped the Key Concepts Here?
A study was conducted to evaluate effectiveness of two intervention programs that aimed to increase colon cancer screening, results are summarized in the table below (Note the control group is used as reference group here):
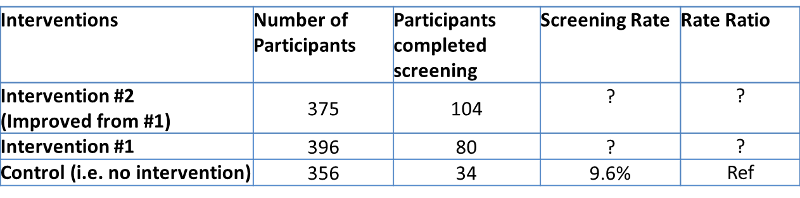
Based on above table, answer the following questions:
The following questions refer to this professional scenario:
You are a heath educator in a large county health department. You noticed that low birth weight (LBW) rate in your community is much higher than neighboring communities. You want to see if the cigarette consumption of mothers during pregnancy may have caused the low birth weight. You collected information on approximately 4000 pregnancies in terms of mothers cigarette consumption and whether a new born is considered low birth weight (LBW) or not. Results are summarized as the following (Note the nonsmoker is used as the reference group here):
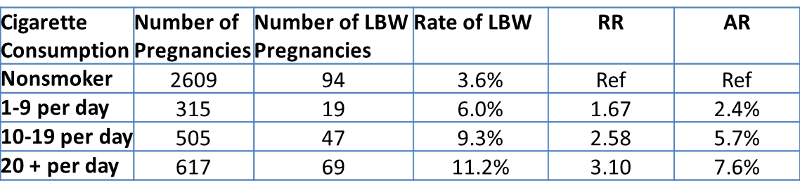
Based on the table above, answer the following questions: