Another Example on MOAs When Both Variables Are Nominal
You are the Director of a large urban county health department. The rate of coronary heart disease (CHD) of your county is 2.1 times that of the state average. You know that both cigarette smoking and exposure to environmental tobacco smoke increase the risk of coronary heart disease. You are considering proposing to the mayor a comprehensive smoking ban. Comprehensive smoking bans prohibit smoking in workplaces, including public and private work sites, restaurants, and bars. Studies have shown that comprehensive smoking bans reduce exposure to environmental tobacco smoke, whereas smoking restrictions, which permit designated smoking areas or provide separately ventilated sections, are not effective at preventing or eliminating exposure to environmental tobacco smoke. Before you propose this idea to the mayor, you need more data to support it. You came across an article entitled "The Impact of Massachusetts's Smoke-Free Workplace Laws on Acute Myocardial Infarction Deaths" in American Journal of Public Health, November 2010. In this article, authors compared Acute Myocardial Infarction (AMI)[1] mortality rate for Massachusetts residents aged 35 and older before and after implementation of the comprehensive state ban on smoking.
The most important finding from this article is summarized in the table below:
|
|
AMI Mortality Rate Before Ban (per 100,000 person) |
AMI Mortality Rate After Ban (per 100,000 person) |
Rate Ratio[2] |
|
Total |
109.2 |
82.5 |
0.76[3] |
|
Age |
|
|
|
|
35-64 |
22.2 |
18.1 |
0.82[4] |
|
65-74 |
151.2 |
102.5 |
0.68[5] |
|
≥75 |
567.1 |
432.2 |
0.76[6] |
|
Gender |
|
|
|
|
Men |
117.9 |
91.7 |
0.78[7] |
|
Women |
101.7 |
74.5 |
0.73[8] |
[1] Myocardial infarction (MI) or acute myocardial infarction (AMI), commonly known as a heart attack. is the interruption of blood supply to a part of the heart, causing heart cells to die. This is most commonly due to occlusion (blockage) of a coronary artery following the rupture of a vulnerable atherosclerotic plaque, which is an unstable collection of lipids (fatty acids) and white blood cells (especially macrophages) in the wall of an artery.
[2]rate ratio is calculated using 'Before Ban" as the reference.
[3] 82.5/109.2 = 0.76 = 76%
[4] 18.1/22.2 = 0.82 = 82%
[5] 102.5/151.2 = 0.68 = 68%
[6] 432.2/567.1 = 0.76 = 76%
[7] 91.7/117.9 = 0.78 = 78%
[8] 74.5/101.7 = 0.73 = 73%
Now can you explain to the mayor and the public:
A. What does each of the rate ratio in the above table mean?
B. Was Massachusetts's Smoke-Free Workplace Laws effective in reducing AMI mortality rate across gender and age groups?
ANSWER:
In the above example, we are looking at the association between two nominal variables. One is smoking ban (Before, After) and the other is death from AMI (Yes, No). Similar to the benzene exposure and leukemia; instead of calculating leukemia rate among workers exposed to benzene and among workers not exposed to benzene, here, rate of death from AMI is calculated for before smoking ban and after smoking ban. In this article, not only the overall/total rates of AMI mortality (i.e. entire population was included) were compared before ban and after ban, rates of AMI mortality for subpopulation groups by either age or gender are also compared before ban and after ban.
A. Interpretation of each rate ratio in the table:
[3] 82.5/109.2 = 0.76 = 76%;
Overall, AMI mortality rate after ban is 0.76 times as great as the rate before the ban; or
Overall, AMI mortality rate after ban is 76% of the rate before the ban, or
Overall smoking ban reduce the AMI mortality rate by 24% (1 -76% = 24%).
[4] 18.1/22.2 = 0.82 = 82%;
For people aged 35-64, AMI mortality rate after ban is 0.82 times as great as the rate before the ban; or
For people aged 35-64, AMI mortality rate after ban is 82% of the rate before the ban; or
For people aged 35-64, smoking ban reduce the AMI mortality rate by 18% (1 -82% = 18%).
[5] 102.5/151.2 = 0.68 = 68%;
For people aged 65-74, AMI mortality rate after ban is 0.68 times as great as the rate before the ban; or
For people aged 65-74, AMI mortality rate after ban is 68% of the rate before the ban; or
For people aged 65-74, smoking ban reduce the AMI mortality rate by 32% (1 -68% = 32%).
[6] 432.2/567.1 = 0.76 = 76%;
For people aged 75 or older , AMI mortality rate after ban is 0.76 times as great as the rate before the ban;
For people aged 75 or older , AMI mortality rate after ban is 76% of the rate before the ban; or
For people aged 75 or older, smoking ban reduce the AMI mortality rate by 24% (1 -76% = 24%).
[7] 91.7/117.9 = 0.78 = 78%;
For males, AMI mortality rate after ban is 0.78 times as great as the rate before the ban; or
For males, AMI mortality rate after ban is 78% of the rate before the ban; or
For males, smoking ban reduce the AMI mortality rate by 22% (1 -78% = 22%).
[8] 74.5/101.7 = 0.73 = 73%;
For females, AMI mortality rate after ban is 0.73 times as great as the rate before the ban; or
For females, AMI mortality rate after ban is 73% of the rate before the ban; or
For females, smoking ban reduce the AMI mortality rate by 27% (1 -73% = 27%).
B. Was Massachusetts's Smoke-Free Workplace Laws effective in reducing AMI mortality rate across gender and age groups?
As we can see in rate ratios broken down by age groups and gender, all rate ratios shows a reduction (ratio ratios are less than 1) in AMI mortality rate after ban. So Massachusetts's Smoke-Free Workplace Laws effective was effective in reducing AMI mortality rate across gender and age groups.
Note the above example shows an application of MOAs in evaluating the effectiveness of certain intervention programs. In this case, intervention program reduced rate of certain disease, indicated by rate ratio of less than one.
One More Example on MOAs When Both Variables Are Nominal
You are an Environmental Health and Safety professional working with a plastic products producer. There are over 100 extrusion presses on the floor. The process begins by heating the stock material. It is then loaded into the container in the press. A dummy block is placed behind it where the ram then presses on the material to push it out of the die. Afterward the extrusion is stretched in order to straighten it. Frequently, when reaching into the press to remove the product, the worker sustains a burn to the forearm.
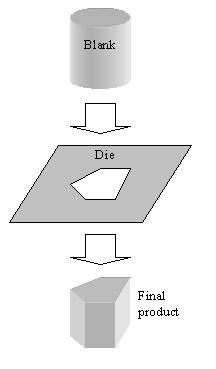
Above illustration shows extrusion of a round blank through a die.
You design a new guard to protect the worker against burns without interfering with the work process. To try your guard you select 10 test machines and install the guard. You also select 10 control machines without the new guard. You monitor the number of burns sustained by workers on each machine over the next two weeks. Your data are below.
Number of burns sustained on 10 guarded and 10 un-guarded presses
|
MACH |
BURNS |
GUARD |
|
1 |
0 |
1 |
|
2 |
1 |
1 |
|
3 |
12 |
1 |
|
4 |
3 |
1 |
|
5 |
3 |
1 |
|
6 |
7 |
1 |
|
7 |
8 |
1 |
|
8 |
10 |
1 |
|
9 |
4 |
1 |
|
10 |
4 |
1 |
|
11 |
12 |
0 |
|
12 |
6 |
0 |
|
13 |
13 |
0 |
|
14 |
4 |
0 |
|
15 |
3 |
0 |
|
16 |
12 |
0 |
|
17 |
11 |
0 |
|
18 |
15 |
0 |
|
19 |
8 |
0 |
|
20 |
14 |
0 |
MACH=press ID number, BURNS=number of burns in period, GUARD= presence of guard (1 - Yes, 0 - No)
A. Identify the subjects, dependent variable(s) and independent variable(s)
B. Construct a standard table and use the MOAs to determine the extent to which the guards seem to be working (does the presence of a guard reduce the risk of burns?). Explain your results using the MOAs. Clarity in your presentation (use a table) and your analysis of data are important. (NOTE: convert BURNS to a dichotomous variable, with 10 or more burns being "High")
ANSWER:
A. Subjects: Plastic extrusion presses
Dependent Variable: Burns (Quantitative)
Independent Variable: Presence of Guard (Nominal: Yes, or No)
B. In order to use RR as a measure of association, the BURN variable had to be converted from a quantitative variable to a dichotomous (categorical) variable. Burn counts of 10 or more were categorized as "High", below 10 was "Low". This produced the following results (Note the group with presence of guard is used as reference):
| Guard
|
Number of Machines |
Number with High Burn Count |
High Burn Rate |
Relative Risk of High Burn |
Attributable Risk of High Burn |
Attributable Proportion of High Burn |
|
Present |
10 |
2 |
20%[1] |
|
|
|
|
Absent |
10 |
6 |
60%[2] |
3[3] |
40%[4] |
67%[5] |
[1] 20% = 2/10
[2] 60% = 6/10
[3] 3 = 60%/20%
Interpretation: the risk of high burn among machines without guard is 3 times as great as the risk among machines with the guard installed.
[4] 40% = 60% - 20%
Interpretation: Lack of guard seems to increase the risk of high burn by 40%
[5] 67% = 40%/60%
Interpretation: 67% of the high burn risk among machines without guard appears to be due to lack of the guard.
Comparing the 60% high burn rate among machines lacking the guard with the 20% burn rate among machine with the guard, the guard seems to be producing a dramatically lower burn rate. In fact machines without the guard are 3 times as likely to have a high burn rate as those with the guard installed. It strongly suggests that the guard should be installed of on all machines.