Learning Objectives:
After successfully completing this lesson, you should be able to:
1. Describe the relationship between sample size and confidence
2. Interpret confidence interval and margin of error
3. Describe the relationship between sample size, margin of error and confidence interval
4. Make a decision as a health professional with confidence interval
5. Interpret the P-value
Sample size and Confidence
A street entertainer offers to give you $20 if you can guess the percentage of poker chips in his hat that are red. You can draw three chips from the hat without looking. One of three comes up red. What will you guess? 33%, right?

He offers to let you draw another 3 chips to improve your guess, but now you can only win $10. Will you guess 33% or pick another 3 chips? He says, to make it easier, you could pick 9 more chips, but now you can only win $5. What will you do?
This is similar to the dilemma we face in research. The more subjects we include in our study, the more confident we can be in our results. However, it costs more to include more subjects, so the net benefit of the research may be diminished. The comic below is certainly exaggerated, but it made a good point.
At what point does the increased cost outweigh the value of the additional information? How much uncertainty remains, when we finally select our subjects and collect our data? These are the essential questions of the source of error we call CHANCE.
Understanding Chance
One way to understand CHANCE is to use a sampling analogy. Assume you have a large group of people, which we call a population. Assume that 30% of these people are HIV+. You then randomly draw a sample of 20 people from this population. You would expect that 6 people in this group would be HIV+. But if you found 7, would you be shocked? No. You know that just by the "luck of the draw" (CHANCE), you're not going to get exactly 30% in every sample.
If you draw many samples of 20, you know that more samples will have 6 HIV+ people than any other number, though many will have 5 or 7 HIV+ people Some smaller number will have 4 or 8 HIV+ people. You would expect very few samples to have, say, 0 or 15 HIV+ people. What is being described here is a sampling distribution of a proportion. Similarly, with other statistics like average, average calculated from a sample may be different from the true average of the population from which the sample is drawn, just by the 'Luck of the draw" (CHANCE), as indicated below.
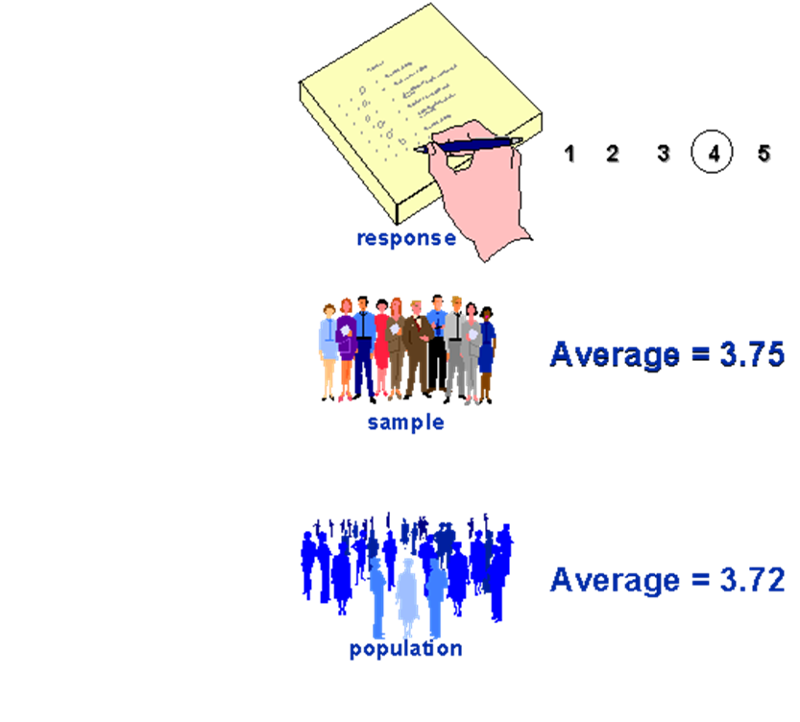
If we draw many samples and calculate an average from each sample, we will have a distribution of these averages - i.e. sampling distribution of the average.
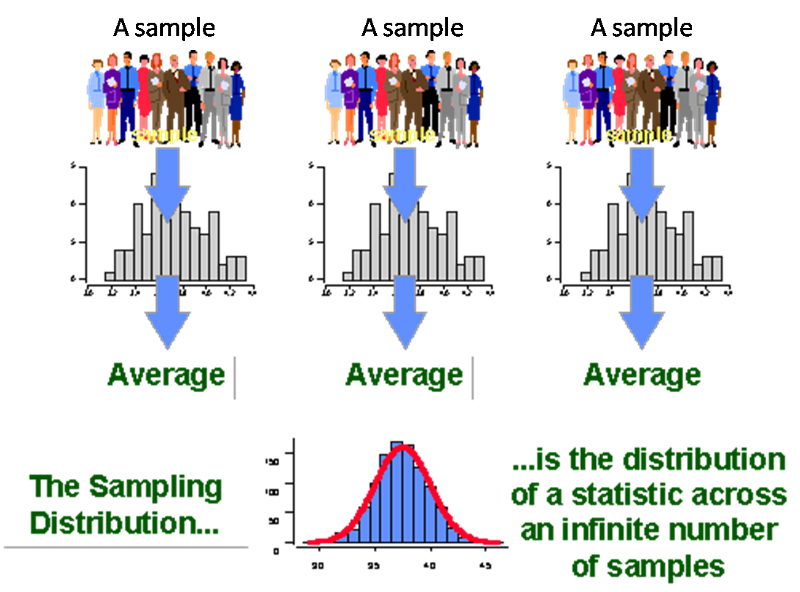
Though you do not need to understand exactly how, the sampling distribution is used to quantify the uncertainty created by "the luck of the draw." We quantify this uncertainty in two ways: confidence intervals and p-values.