Confidence Intervals
The Margin of Error
Even if you aren't familiar with confidence intervals, you've probably unknowingly run across them. You've probably heard the term "Margin of Error" used along with the results of a survey of, say, a presidential poll.
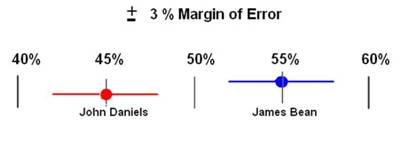 After polling 1000 eligible voters, the Star-Tribune Newspaper reported that 55% of Americans would vote for James Bean and 45% for John F Daniels +/- 3%.
That plus or minus disclaimer is the margin of error. In other words, the margin of error means that James Bean could be favored by as much as 58 to 42 percent (55 + 3) or as low as 52 to 48 percent (55 - 3)-- a six percentage point spread (58-52 = 6). This spread is the Confidence Interval [1] (move your mouse over the colored text to find out more).
There's our friend the Margin of Error. It can be used whenever samples are taken and an estimate is made about a larger population. Did you also notice that the margin of error is half the confidence interval? So an easy way to know the confidence interval if all you know is the margin of error is to multiply the margin of error times two.
So remember the confidence interval = 2 times the Margin of Error
Smaller Sample Vary More
There's another important point that's worth noting: The smaller the sample, the more variable the responses will be and the bigger the margin of error.[2] (move your mouse over the colored text to find out more).
Let's say the population was going to vote 55% for Jim and 45% for John and the Star Tribune only asked five people instead of 1000. With a smaller sample, they increase the chance that they are getting a result that's different than the whole population. Imagine if the Star-Tribune took the same poll as in the example above but only asked 5 people instead of 1000 people. Let's say they took the poll six times. The results might look something like this:
Result of Star-Tribune Poll done 6 times with only 5 Users
|
|
Poll 1 |
Poll 2 |
Poll 3 |
Poll 4 |
Poll 5 |
Poll 6 |
|
Votes for Jim |
5 |
4 |
2 |
0 |
1 |
3 |
|
Votes for John |
0 |
1 |
3 |
5 |
4 |
2 |
|
Poll Results |
100 to 0 |
80 to 20 |
40 to 60 |
0 to 100 |
20 to 80 |
60 to 40 |
Look at the poll results above. Notice how the results are all over the place? We know that the population will vote 55% for Jim and 45% for John; but if the newspaper reported the results with only 5 people, they could be way off. By sampling more people they will reduce their chances of being way off.
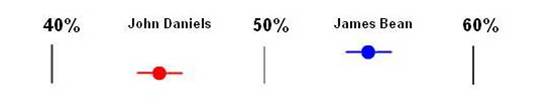
The important point is that as samples get larger, the amount of variability goes down: Larger samples have a smaller margin of error (less variability) and smaller samples have a higher margin of error (more variability). This is a point that will continue to appear in confidence intervals.
95% CI for sample size of 100 (n=100)
95% CI for sample size of 100 (n=1000)
95% CI for sample size of 100 (n=10000)
"Overlap"
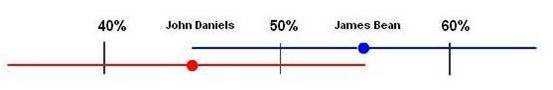
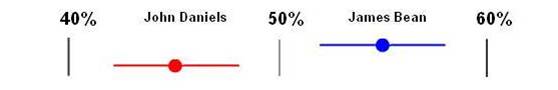
Now, If you've ever heard the news say a race is too close to call or there's a "statistical tie" it's because the width of both confidence intervals are overlapping enough that there's no clear leader. What does that mean? Imagine that a lot fewer people were surveyed for the poll taken by the Star-Tribune Newspaper and the margin of error was now +/- 6%. This new relationship is displayed in the figure below.
6% Margin of Error causes confidence intervals to overlap
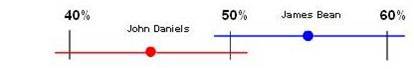
Notice how part of the confidence intervals overlap? The + 6% Margin of Error on the top of John Daniel's 45 % overlaps with the - 6% of Jim Bean's 55%. This means that if the poll were to be taken again, there's a reasonable chance that John Daniels might be leading over Jim Beam in the polls. So in this case, we can not be confident to say that James Bean is the leader.
Interpreting Confidence Interval
In the above sections, we have discussed how confidence intervals come about and how they are influenced by sample size. Now if we are given a confidence interval, how should we interpret it?
For example, in a study of water samples randomly taken from a river polluted by crude oil, 95% CI of crude oil concentration is 20 to 60 ppm. This can be interpreted as "We are 95% confident that crude oil concentration is 40 ppm, with a margin of error of +/- 20 ppm".
Another example, in a study of effectiveness of the antidepressant buproprion for quitting smoking, we found 95% CI of proportion not smoking after six months of antidepressant buproprio treatment is 0.25 - 0.45 while 95% CI of proportion not smoking after six months of taking placebo (A placebo looks like the real drug but has no active ingredients, such as sugar pill) is 0.10 - 0.30. This can be interpreted as "We are 95% confident that the proportion not smoking after six months of antidepressant buproprio treatment is 0.35 ( (0.25 + 0.45)/2 = 0.35), with a margin of error +/-0.10 (0.35 +/-0.10 gives the range of 0.25 - 0.45)" and "We are 95% confident that the proportion not smoking after six months of taking placebo is 0.20 ( (0.10 + 0.30)/2 = 0.20), with a margin of error +/-0.10 (0.20 +/-0.10 gives the range of 0.10 - 0.30)".
Another example, in a study of breast cancer, we found 95% CI of RR of breast cancer for those women with high fat diet is 1.27 - 4.79. This can be interpreted as "We are 95% confident that the breast cancer risk of women who are on high fat diet is between 1.27 and 4.79 times as likely as those who are not on fat diet".